How to Read an Elevation Profile and Plan Your Hiking Effort
You found a hike on OpenRando, you pull up the elevation profile, and you wonder: is this within my abilities? The line climbs, dips, climbs again… But what is it actually telling you? And just as importantly — what is it hiding?
An elevation profile is not a picture to admire. It is a technical document to read. The difference between a hiker who reaches the summit with energy to spare and one who is suffering by the halfway point often comes down to how carefully they interpreted that graph before setting off.
This guide gives you a complete method: understanding what the profile reveals, what it conceals, how to calculate slope gradient, spot the hard sections, and estimate your hiking time accurately.
What a Profile Shows — and What It Hides
An elevation profile plots altitude against horizontal distance traveled. The horizontal axis shows kilometers of trail; the vertical axis shows altitude in meters. Straightforward, at first glance.
But two critical parameters are easy to miss.
The vertical axis scale is often exaggerated. Mapping platforms automatically adjust the altitude axis so the profile looks readable. A gently rolling hike may show dramatic-looking ascents if the axis spans only 200 m, while an alpine hike with 2,000 m of elevation gain can look gentler visually if the scale stretches further. Before interpreting anything, read the numbers on both axes — not just the shape of the curve.
Distance and slope are visually independent. A short but steep section can look less daunting than a long plateau. Train yourself to read both dimensions together: how many meters of elevation gain over how many horizontal kilometers.
Finally, the profile never shows you what the terrain is actually like. A 20% gradient on a paved path is nothing like the same slope on wet roots or scree. Reading the profile is a starting point — trail-level knowledge fills in the rest.
Horizontal Distance vs. Real Distance
This is the first trap for beginners. The distance shown on a profile — and often in a route's summary — is a flat, map-projected distance: it is measured as if you were looking down from above.
Your actual walking distance is always longer, especially on steep terrain.
The exact formula: for a horizontal segment of d km with D meters of elevation gain, real distance equals:
real distance = √(d² + (D/1000)²)
In practice, for slopes below 20%, the difference is less than 2%. For slopes of 30-40% (steep but walkable), the gap grows to 4-8%. Small individually, but it accumulates over a long day.
More importantly: the real fatigue of a climb comes from elevation gain, not horizontal distance. Experienced hikers think in minutes per 100 meters of gain as much as in kilometers walked.
Calculating Average Gradient
Slope is the ratio of elevation gain to horizontal distance, expressed as a percentage.
Formula:
Slope (%) = (elevation gain in meters / horizontal distance in meters) × 100
Practical examples:
- 100 m gain over 1 km → 10% (gentle slope, accessible to everyone)
- 200 m over 1 km → 20% (typical mountain hike)
- 400 m over 1 km → 40% (very steep, may require hands)
On OpenRando, each route displayed on the map includes total positive elevation gain and distance. Divide the first by the second (in meters) to get the hike's overall average gradient.
Average gradient, however, is a misleading indicator on its own. A hike with 500 m gain over 10 km has an average of 5% — but if those 500 m are packed into a 2 km section in the middle, you're facing a 25% wall surrounded by flat terrain. This is why reading slope breaks is essential.
Spotting Slope Breaks
A slope break is a sudden change in gradient on the profile: a shift from a gentle section to a sharp rise, or vice versa. These are where the most demanding — and sometimes most rewarding — moments of the hike happen.
How to identify them:
On the profile, look for sections where the curve changes direction sharply (as an angle, not a smooth curve). These are the points where your effort level will shift abruptly.
What different slope breaks mean:
- Abrupt ascent after a long gentle section: your body will already be tired. This section will feel harder than if you'd tackled it fresh. Plan a short break just before it.
- Long false flat (3-5% over several km): often underestimated. It quietly grinds down your calves and hips without ever allowing real recovery.
- Steep descent after the summit: your knees take prolonged eccentric braking stress. Unprepared hikers develop quad soreness within hours. A pair of telescopic trekking poles makes a significant difference on the way down.
- Climb after a descent: often the hardest moment psychologically. You've recovered somewhat, then you have to push again. Keep some calories in reserve for these transitions.
Estimating Your Time with Naismith's Rule
Formulated by William W. Naismith in 1892, this empirical rule remains the standard reference for estimating hiking duration. It is simple, robust, and surprisingly accurate for an average hiker.
Basic rule:
- 1 hour per 5 km on flat terrain
- + 1 hour per 600 m of positive elevation gain
Example: a 15 km hike with 900 m of positive elevation gain:
- Distance: 15 / 5 = 3 h
- Elevation: 900 / 600 = 1.5 h
- Estimated time: 4 h 30
This figure does not include breaks. In practice, add 20-30% for stops, photos, lunch, and the unexpected.
Adjustments to apply:
Naismith assumed a fit hiker on a clear, well-marked trail. Adjust as follows:
| Situation | Adjustment |
|---|---|
| Difficult terrain (scree, snow) | +25-50% |
| Hiking with children | +50-100% |
| Very steep descent | +30 min per 300 m |
| Heavy pack (>15 kg) | +20% |
| Large group (>6 people) | +15% |
For very steep descents (slopes above 25%), some hikers add 10 minutes per 300 m of descent. On alpine terrain above 2,000 m, many mountaineers use a tougher variant: 300 m of positive gain per hour rather than 600 m.
A GPS watch with a barometric altimeter lets you track your cumulative elevation gain in real time and compare it against your pre-hike estimate.
The Pitfalls of Smoothed Profiles
Not all hiking apps are created equal when it comes to elevation profile accuracy. Several factors introduce distortions worth knowing about.
Algorithmic smoothing. Most platforms smooth the raw GPS trace to remove sensor noise. As a result, short steep sections disappear from the profile. A path with three sharp 30-meter climbs can appear as a flat plateau. The displayed elevation gain becomes lower than the real one.
Altitude data source quality. Elevation data can come from three sources: the smartphone's GPS sensor, a digital elevation model (DEM) from satellite surveys, or a digitized topo map. High-resolution DEMs (5 m resolution, available in France through IGN) are the most accurate. Profiles generated from a smartphone's GPS at recording time are often noisy and unreliable.
Cumulative vs. real elevation gain. Positive elevation gain is the sum of all ascents. On undulating terrain, every small bump counts. With aggressive smoothing, those micro-variations vanish. Be wary of routes that display suspiciously regular elevation profiles over terrain you know to be rough.
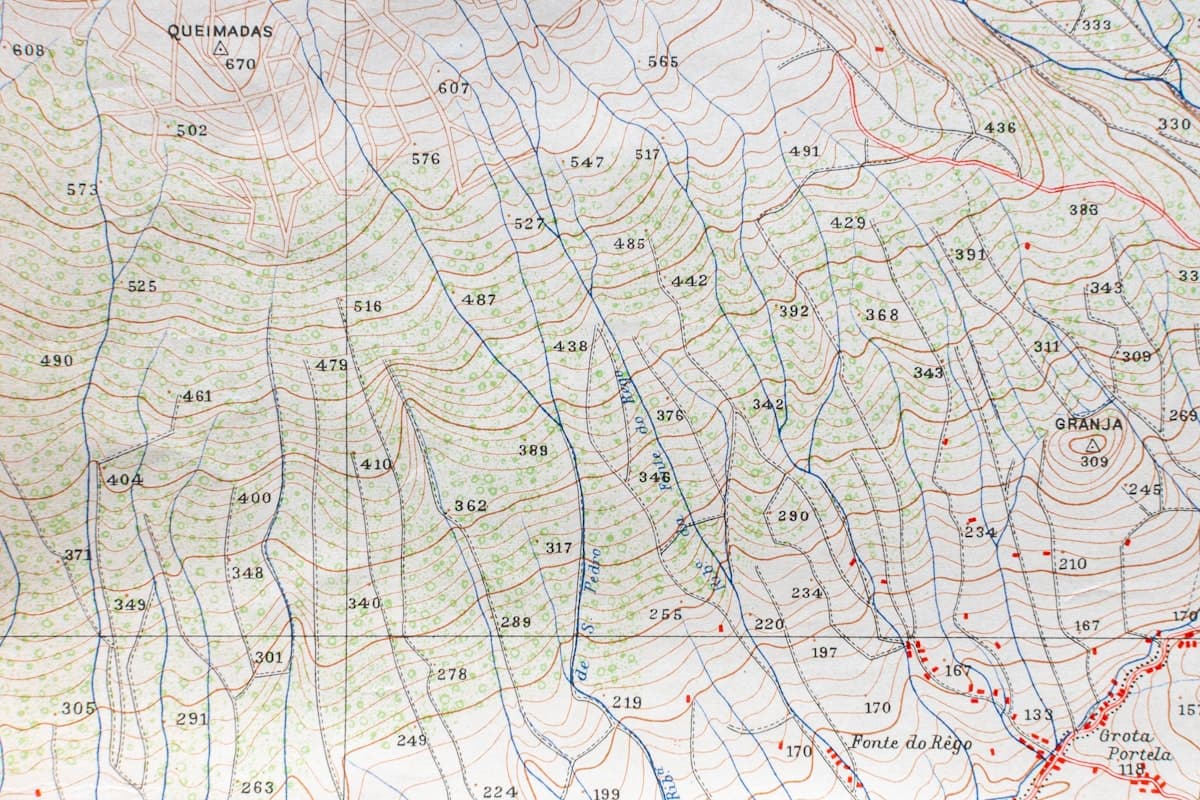
How to verify: Download the GPX file and open it in an external tool like GPSVisualizer or Garmin Basecamp with an SRTM 30m DEM. Or read a detailed 1:25,000 topo map and count the contour lines manually.
False flat endings. On nearly all profiles, the final kilometers look flat because the route returns to the starting trailhead. Don't be fooled. Check the absolute altitudes of those final kilometers — a "flat" section at 1,800 m after 6 hours of walking is still real effort.
Putting It All Together Before You Go
Before each hike, spend five minutes reading the profile systematically:
- Read the axes: what is the vertical range? How many kilometers does one centimeter on the horizontal axis represent?
- Identify segments: divide the route mentally into 3-4 main sections based on their profile (gentle climb, steep climb, descent, flat).
- Calculate each section's slope: elevation gain ÷ distance → percentage.
- Pinpoint the critical slope breaks and where they fall in the day's progression.
- Apply Naismith section by section, not just to the full route. This gives a more accurate time estimate and tells you what time you'll be at each key point.
- Plan breaks at transitions, not at summits. A 5-minute stop before a steep section beats a long rest at the top when your legs are already empty.
The elevation profile is the screenplay of your day. The more carefully you read it in advance, the better prepared you'll be at every stage — and the less likely you are to be caught by surprise.
To find hikes with detailed profiles in your area, explore our route map and filter by elevation gain and difficulty. Every route page includes a full profile with start and summit altitudes and the main slope breaks.
As an Amazon Associate, we earn from qualifying purchases. Links marked with an external icon are affiliate links.
Related reading

How to Calculate Elevation Gain on a Hike
Ascent, descent, cumulative elevation gain, difficulty ratings, Naismith's rule: how to size up any hike before you set off.

Hiking at Dawn: How to Plan a Sunrise Hike
Everything you need to organise a sunrise hike: calculating your departure time backwards, dressing for cold dawn temperatures and hiking safely in the dark.
Tarn Gorges in 3 Days: Rim Trails and River Bottom Hiking Itinerary
Hike the Tarn Gorges in three days: an itinerary alternating cliff-top rim trails and river bottom paths, with detailed stages, elevation profiles, swimming spots and practical tips.